Productivity · 4 min read
How to make a mind map in PowerPoint or Excel (and an easier way)
You want a mind map, and PowerPoint or Excel is already open, so it feels like the obvious place to make one. Both can do it, up to a point. This post shows you how to build a mind map in each, where the work turns fiddly, and a quicker route with a tool made for the job.
Making a mind map in PowerPoint
The fastest start in PowerPoint is SmartArt. Go to Insert, then SmartArt, and pick a layout from the Hierarchy or Relationship groups. Type your central idea, then add branches in the text pane. SmartArt handles the spacing for you, which is fine while the map is small.
The trouble starts when your thinking outgrows the template. SmartArt layouts are rigid, so a real brainstorm quickly hits a shape you cannot add where you want it. The alternative is to drop in shapes and connector lines by hand, which gives you freedom but no automatic layout. Move one shape and its lines stay behind, so you end up nudging everything into place yourself.
Making a mind map in Excel
Excel has no mind map feature, so you are borrowing the drawing tools. Insert shapes for each idea, add connectors between them from the Insert menu, and turn off gridlines under the View tab so the canvas looks clean. Some people instead type the branches into cells and indent them, which is really an outline rather than a map.
Either way you are fighting the grid. Shapes snap to cells you did not mean, connectors do not reflow when you drag a node, and formatting each shape one at a time eats the time you wanted to spend thinking. Excel is built for numbers, and a mind map asks it to be something it is not.
The quicker way with a tool built for it
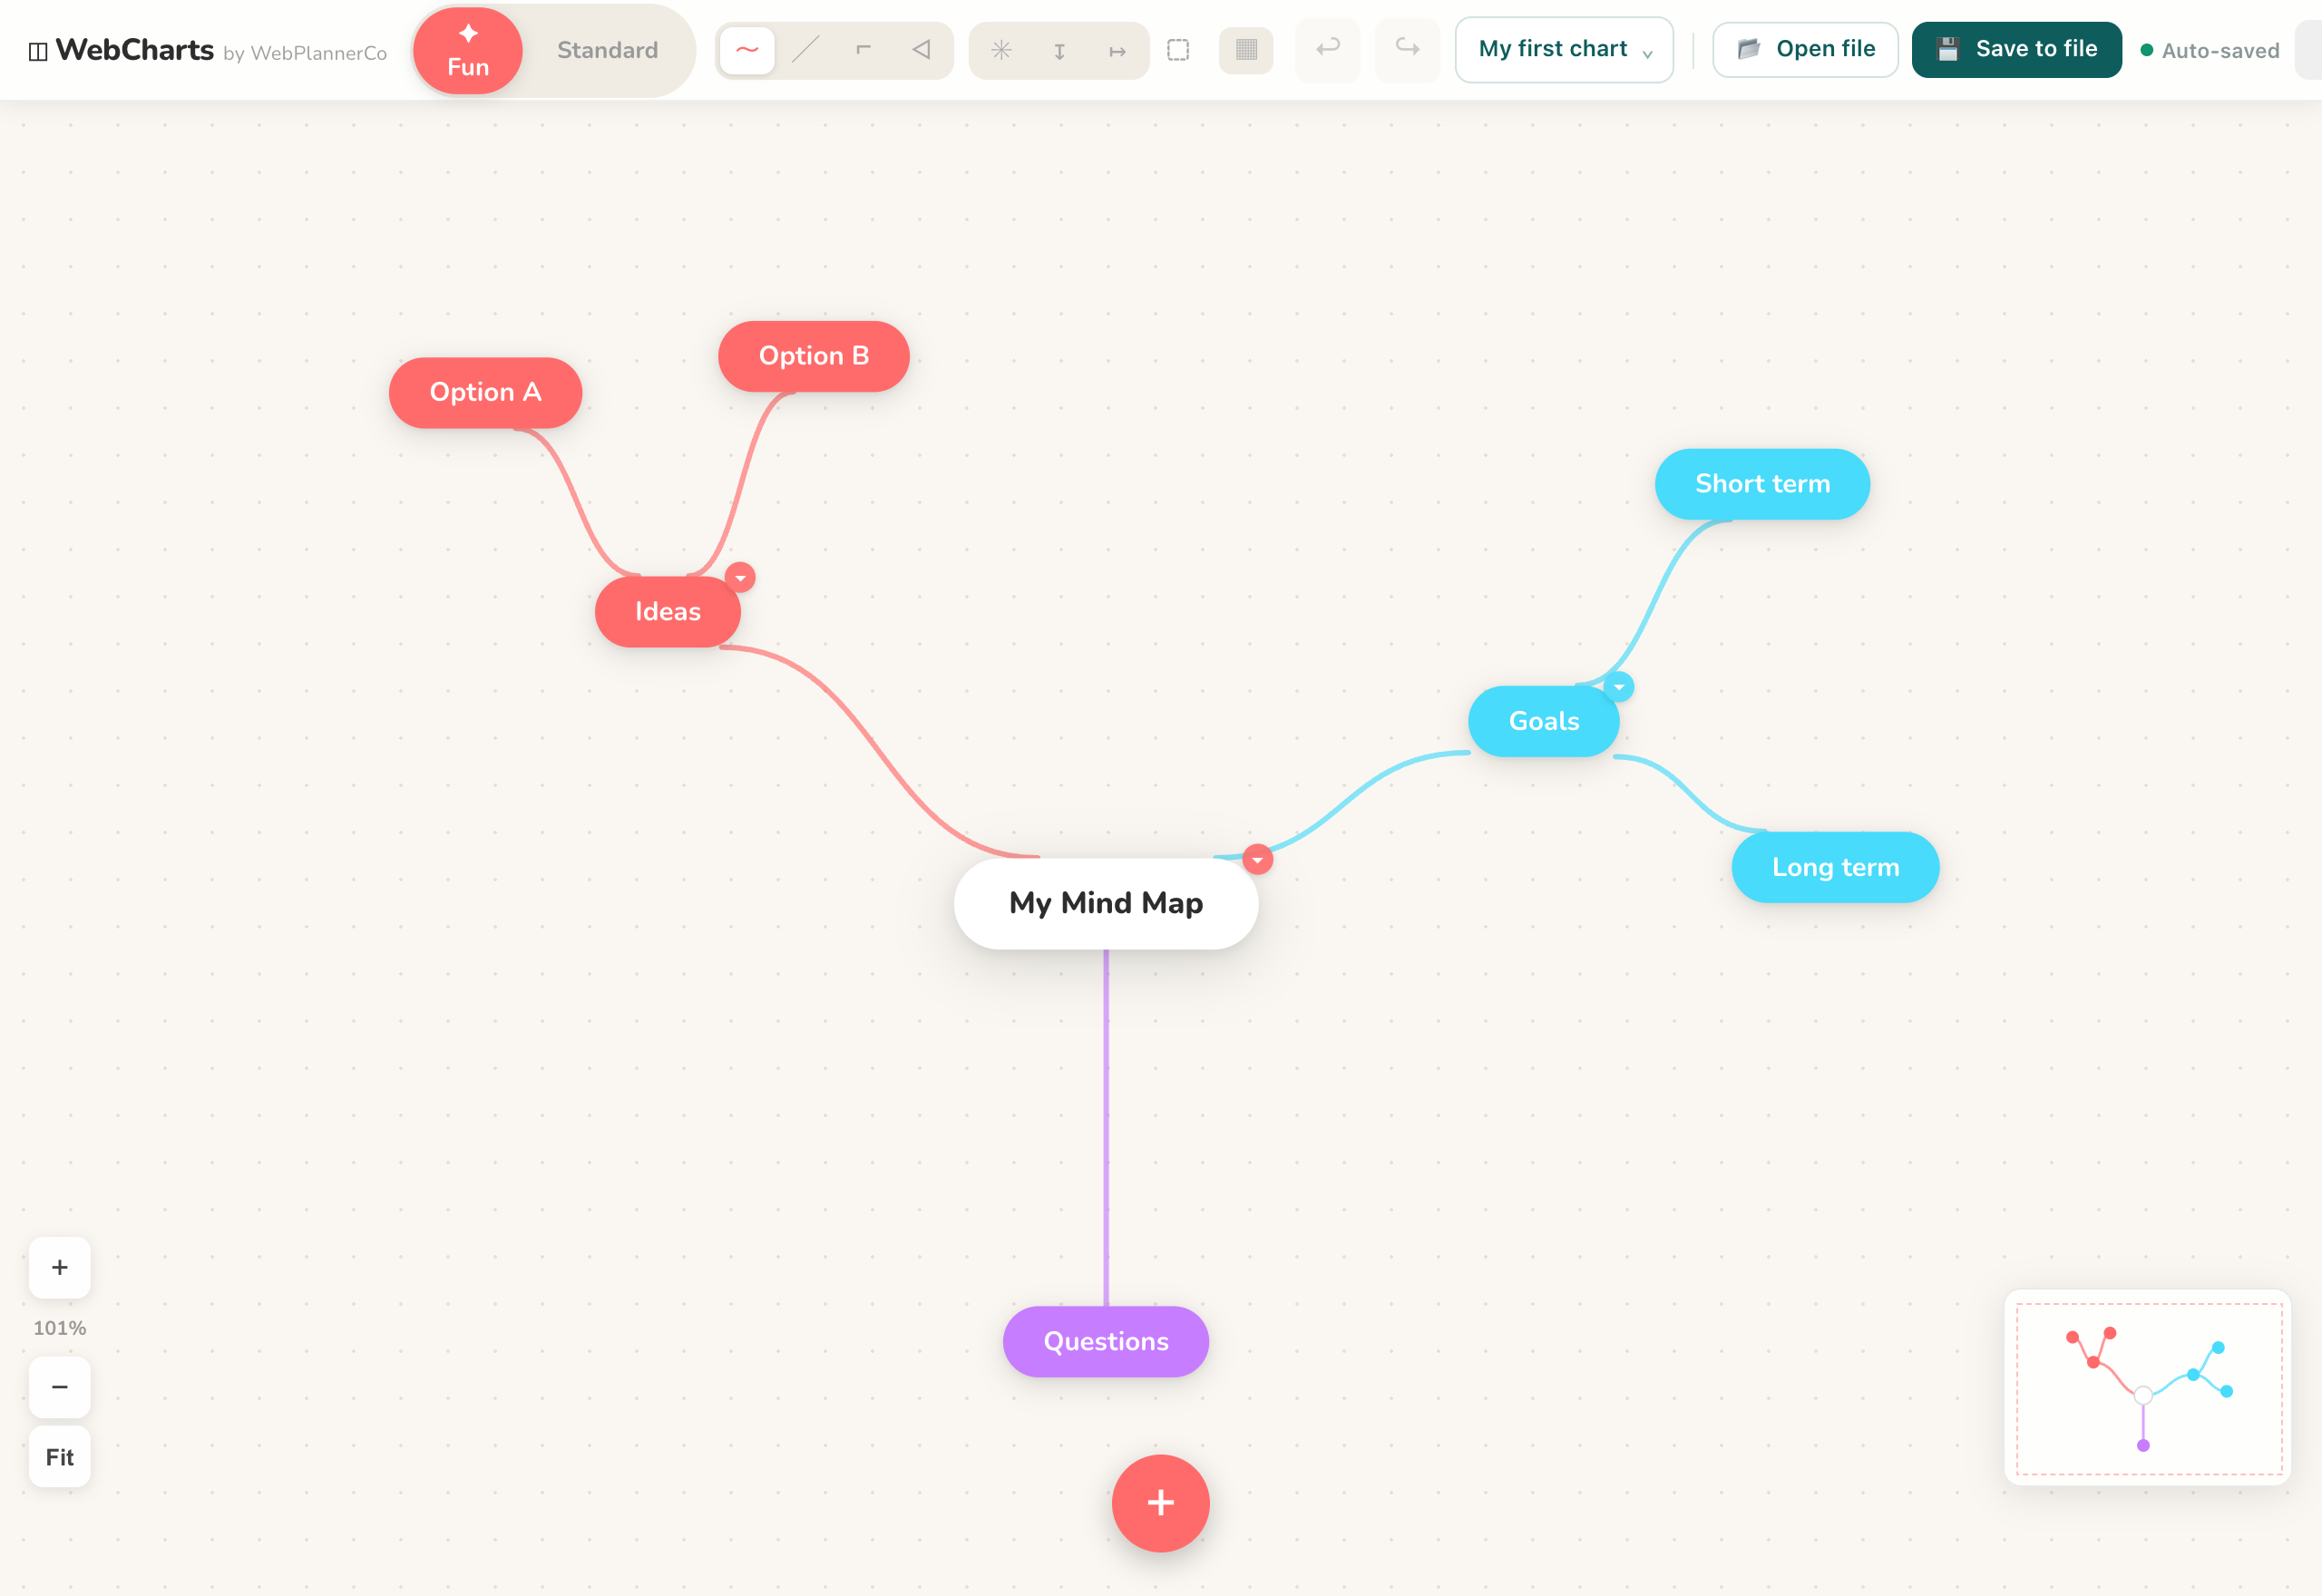
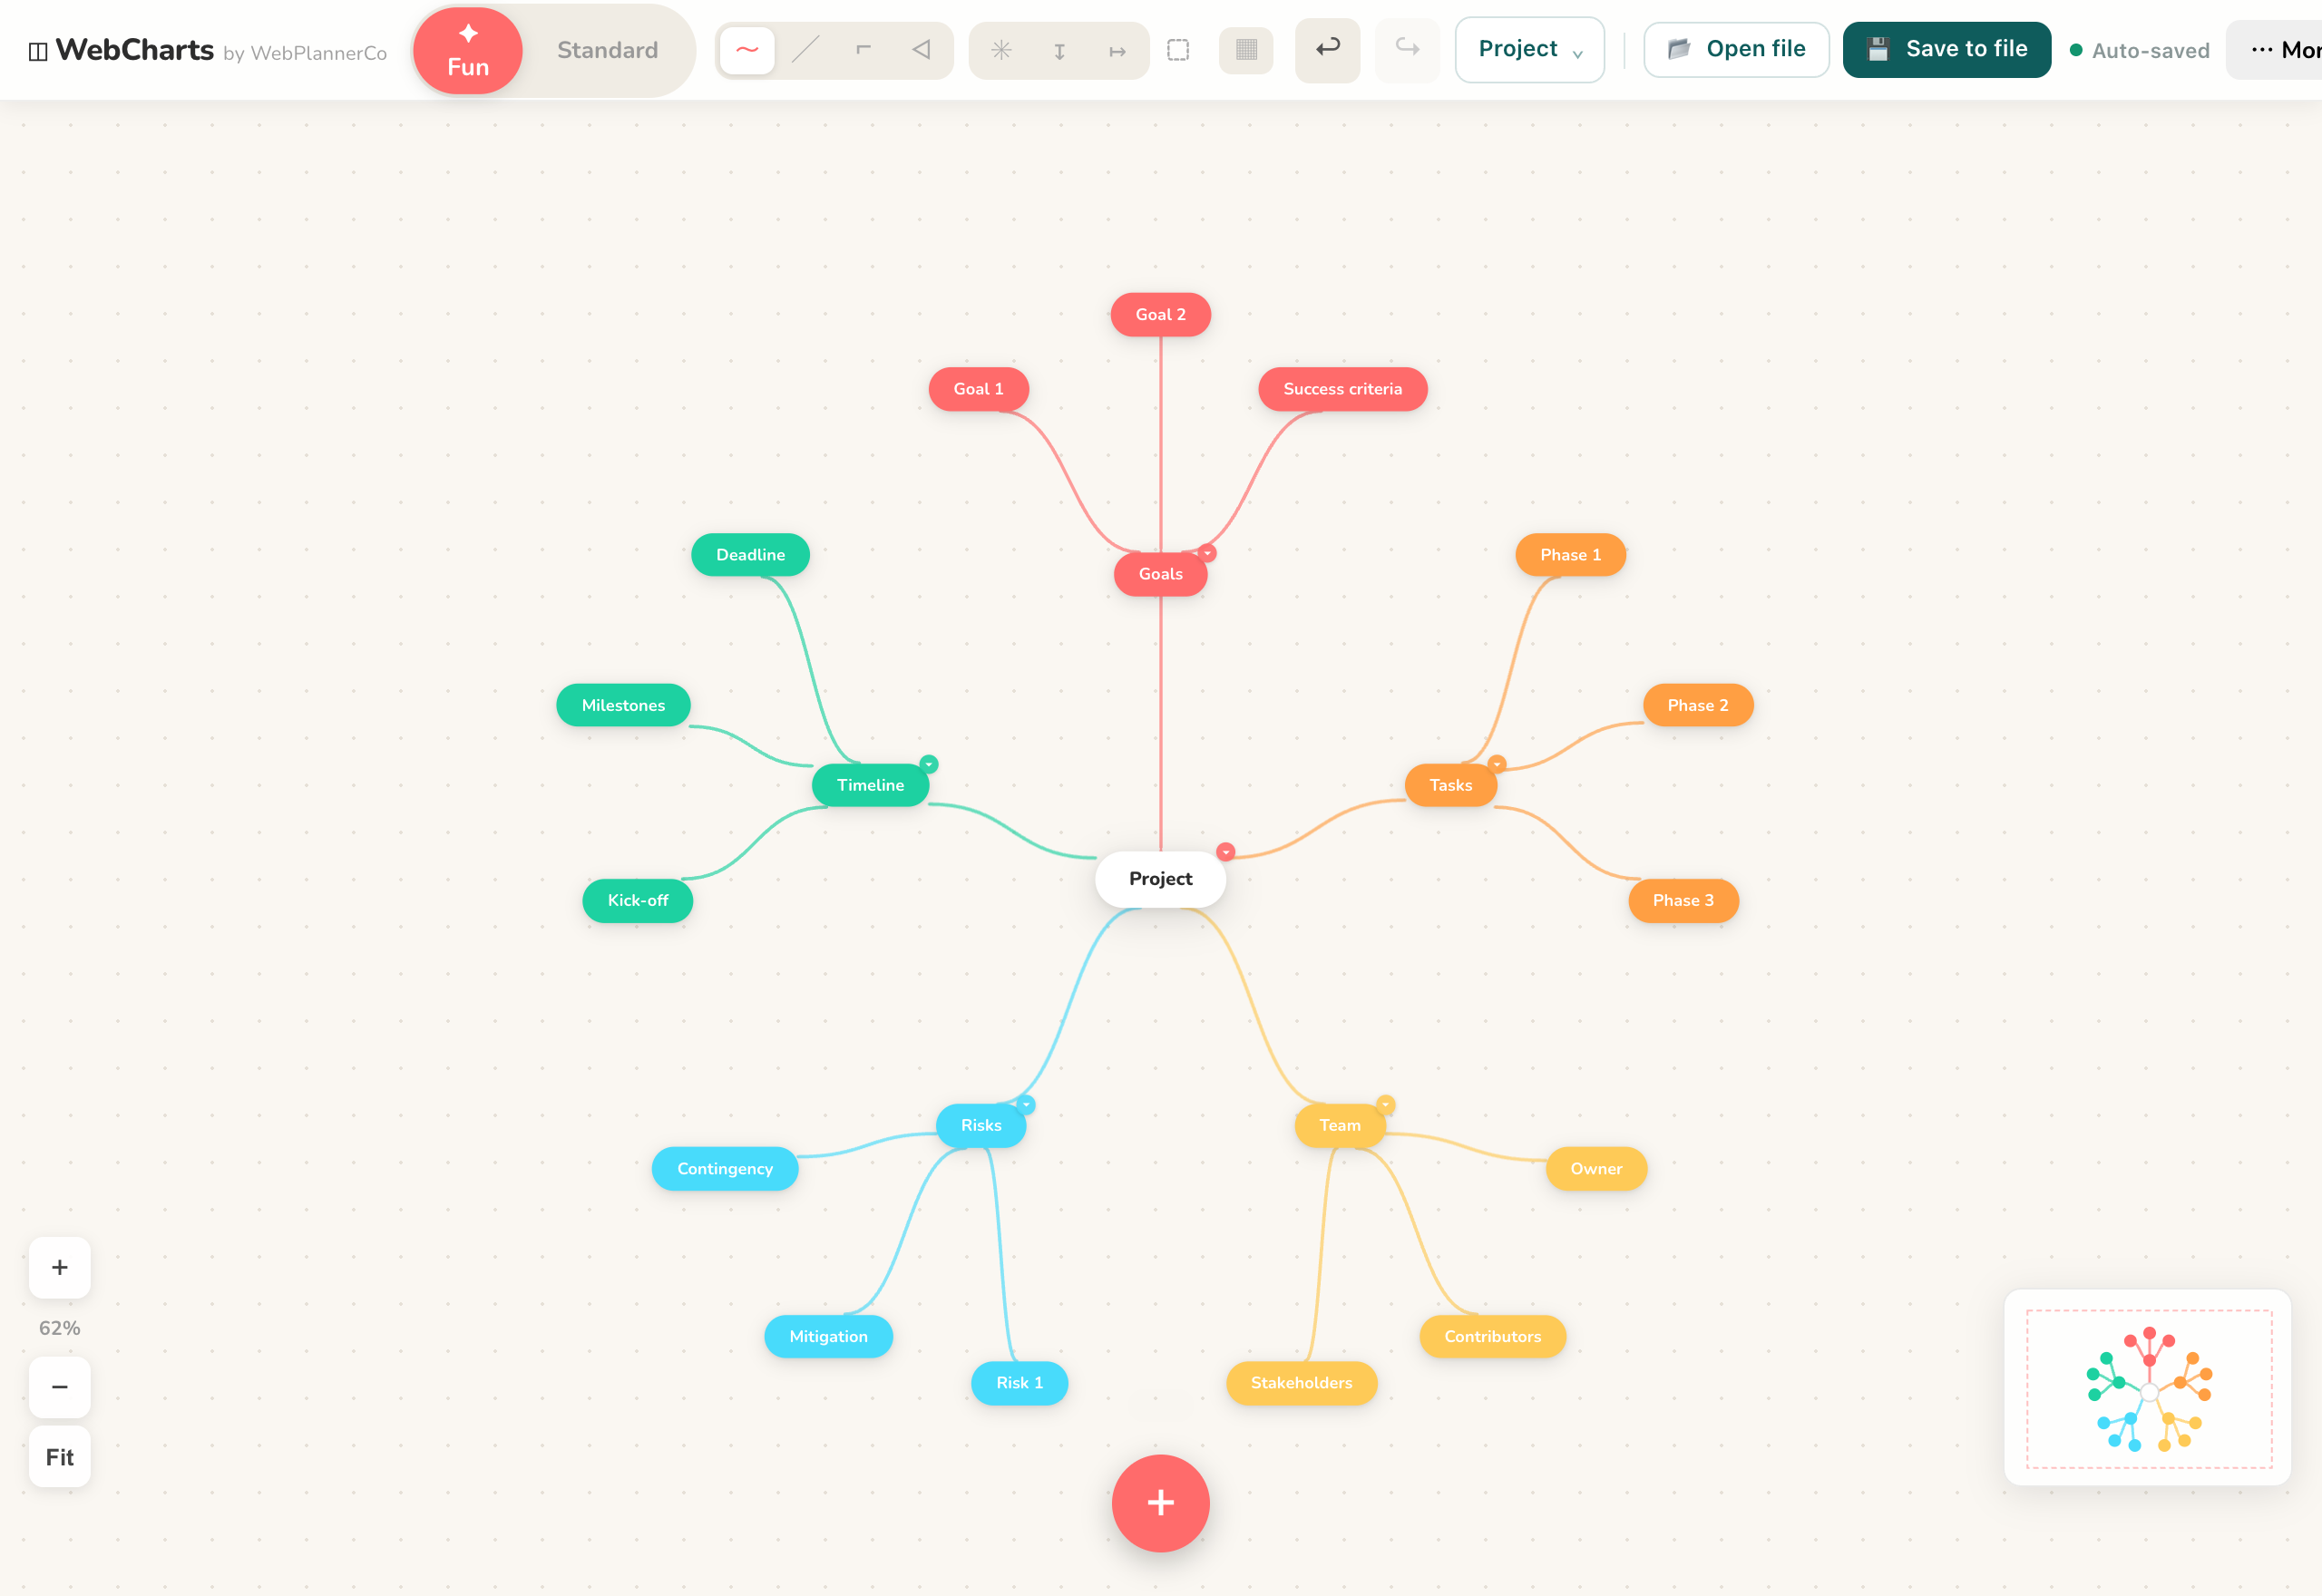
A purpose-built visual tool removes the manual layout work. In our Mind Maps and Diagrams app you double-click the canvas to add a shape, then drag from a shape's edge to connect the next one. When you move a node, its branches move and the connections follow, so the map stays readable while you rearrange your thoughts.
You can start from a Brainstorm template, colour-code branches so related ideas group by eye, and drop an image onto a node when a picture says it faster. When the map is done, export it as an image to drop into a slide or a document. It works offline with no account, so you can open it and start mapping straight away.
The app that helps
Mind Maps & Diagrams
Everything you need to map out your ideas, diagrams, flowcharts, org charts and mind maps, in your browser.
- Double-click the canvas to add a shape and drag from its edge to connect the next, so branches grow as fast as you think
- Branches and connections reflow when you move a node, so nothing is left stranded when you rearrange
- Colour-code branches, drop an image onto a node, and export the finished map as an image for a slide or document
Common questions
Can I turn my mind map into a PowerPoint slide?
Yes. Build the map in the app, export it as an image, then insert that image onto your slide. You get the full layout without rebuilding it in SmartArt.
Do I need an account or an internet connection?
No. The app works offline and needs no account or login. You can open it and start straight away, and your data stays on your device or in your file.
A quick note
This is simply how we like to work, shared in case it helps. Take what's useful and leave the rest.